Data Formatting
How to get your dataset into OLIVER
Any type of data can be loaded into OLIVER, provided that it follows a certain structure. This guide is written with time-resolved data in mind, though that is not strictly necessary.
Do you learn best by example? Click here to download an OLIVER-compatible example dataset.
Start Simple
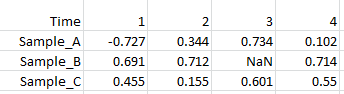
Data should be placed into one or more tab-delimited spreadsheets, each with 2 or more rows and 2 or more columns. Each row should have a unique label in the first column, and columns should have increasing numerical headers (typically indicating timepoints). The remianing cells should be populated with numerical values for each label/timepoint. "NaN" should be used to indicate a missing point. Note that in the example below, OLIVER will ignore the top-left cell.
|
|
|
A minimal OLIVER-compatible spreadsheet |
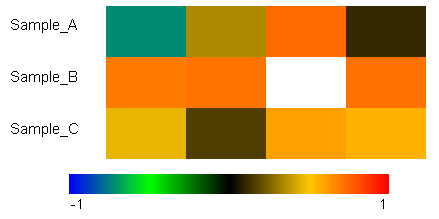
Default visualization in OLIVER |
Once your data is in this format, you should save it to a tab-delimited ".txt" file. Then you can click-and-drag the file into the OLIVER window to load it. This can also be done through the "File" menu in OLIVER. More information about loading data into OLIVER can be found in the Basic Functions section of this guide.
Include Meta-Data in Row Labels
Simple row labels as in the example above are acceptable. However based on an optional "row label template" in the top-left cell, OLIVER can recognize meta-data fields included in the row labels. Meta-data fieldnames in the row label template, and values in the row labels should be enclosed in square brackets.
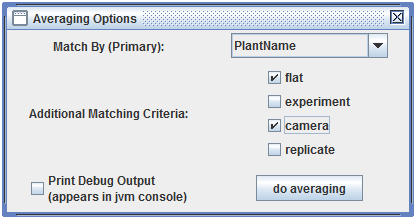
The example below contains some plants' photosynthetic rates over time. Each plant has some associated meta-data e.g. the "flat" (container) where the plant was located, and the camera used to measure each plant. When loaded into OLIVER, certain dialogs will reflect the fields listed in the row label template. The screenshot below shows how you might use OLIVER to reduce a large dataset by averaging together rows with matching "flat" and "camera" meta-data.

|
|
|
OLIVER-compatible spreadsheet with a row label template and meta-data for each row |
OLIVER dialog based on row label template. |
More On Column Labels (Timepoints)
You may have noticed that in the simple example above we have "Time" in the top-left cell of our spreadsheet, followed by increasing numbers 1, 2, 3, 4 (representing different points in time for each column). However, in the second example we have a long row label template rather than "Time". Either way, OLIVER will always treat numerical column headers as timepoints, and only values under numerical column headers will be included in the displayed heatmap. So if your data isn't time-resolved you may need to add placeholders (e.g. 1, 2, 3, ...) in the first row.
Extra Columns (Additional Sample Meta-Data)
One or more extra columns with meta-data can also be added to an OLIVER-compatible spreadsheet. An extra column is represented by any non-numerical header, located to the right side of all the time-resolved data. Extra column can contain catagorical or numerical information, which by default will be represented by a colored bar alongside the heatmap in OLIVER
Since any meta-data can be included in extra column or in the row labels, it is up to the user to decide which is more approiate. It is recommended that you always use extra columns for meta-data that is continuous and numerical, since OLIVER will be able to present those numbers in a smooth color scale. On the other hand, meta-data in the row label will not be visualized by default. Often extra columns are added to datasets during some analysis in OLIVER, whereas metadata contained in the row labels is typicallly set-in-stone.
Extra Rows (Time-Resolved Meta-Data)
For meta-data that does not corespond with any one sample (e.g. experiment conditions that vary over time), it may be appropriate to add an extra row to your dataset. Any extra rows should be located beneath all of the normal rows, and their labels should beigin with an asterisk "*". Otherwise any labels can be used for extra rows, regardless of the row label template.

|
|
OLIVER visualization of a spreadsheet with an extra row labels "*light_intensity". Click here to download the spreadsheet, which is used in one of the example workflows. |