Basic Functions
This guide will help get you familiar with the OLIVER user interface and cover some basic function in detail:
- Loading data from spreadsheets and other sources
- Recoloring and sorting heatmaps
- Save figures in a variety of formats
- Saving heatmaps and workspaces to re-use in OLIVER or open in other programs
Supported Filetypes
In the Data Formatting guide, we only covered formatting tab-delimited spreadsheets. However in the sections below we will refer to some of the other data filetypes supported by OLIVER:
| .txt | Comma- or tab-delimited spreadsheet, containing data for a single heatmap. |
|---|---|
| .zip | Archive containing one or more .txt spreadsheets, each representing a single heatmap |
| .xls or .xlsx | A Microsoft Excel workbook containing a full OLIVER workspace, including data and display settings for each element int he workspace. This format can also be viewed and editted in Excel. |
| .hm | A proprietary filetype representing a single heatmap. This filetype includes the data for the heatmap along with OLIVER diplay settings. |
| .hms | A proprietary filetype representing an OLIVER workspace, including data and display settings for each element in the workspace. Since this format cannot be loaded into other programs, the xls or xlsx formats are usually preferrable. So, the .hms format should be avoided, and is only supported so people can still load datasets previously saved in that format. |
Loading Data
Any of the filetypes listed above can be loaded by clicking-and-dragging the file from your operating system into the OLIVER window.
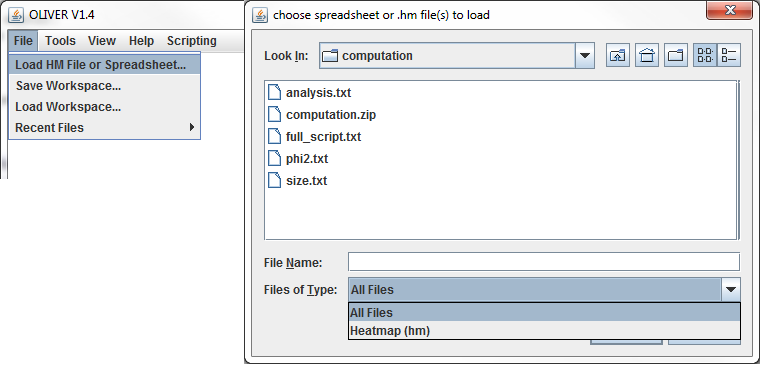
Otherwise, the top-level "File" menu in OLIVER can be used. If you are loading a single heatmap, you shoudl use "File", "Load HM File or Spreadsheet". Keep in mind that if you are loading data from a .txt file, you should click the "Files of Type:" dropdown and select "All FIles". Otherwise only .hm files will be shown in the file chooser window.
|
|
Loading a spreadsheet through the file menu in OLIVER |
Click here to download an example spreadsheet you can try this with. This example is also used in one of the example workflows.
The Heatmap Window
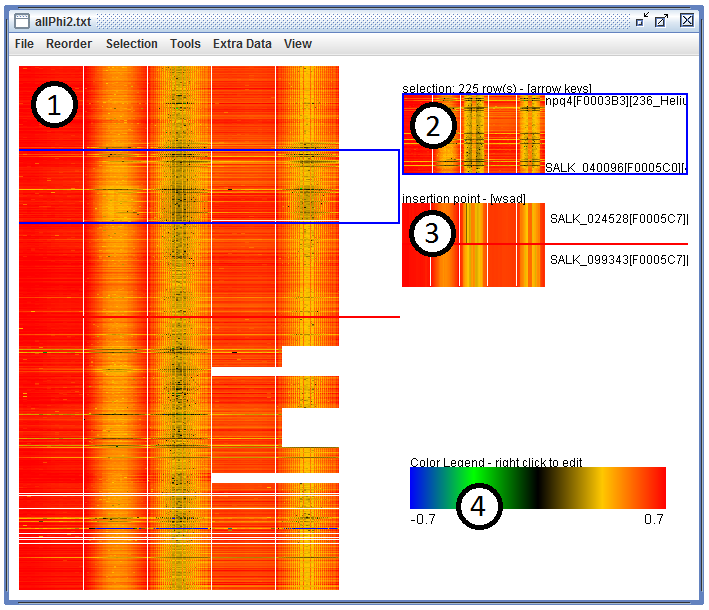
After loading a spreadsheet in OLIVER, it will be displayed using some default settings. You should see a heatmap window with 4 main elements.
- The main heatmap display, where each cell from your spreadsheet is represented as a colored box
- A selection preview, which shows a subset of the rows in your heatmap. This selection is also enclosed by two horizontal blue bars over the main heatmap display, which can be moved by left-clicking and dragging on the heatmap, or using the arrow keys on your keyboard.
- An insertion-point preview, which hichlights a position between two rows in your heatmap. This point will also be shown as a horizontal red bar over tha main heatmap, which can be moved by right-clicking and dragging on the heatmap, or using the W and S keys on your keyboard.
- A color legend, which shows how numerical values are converted into heatmap colors
|
|
The typical heatmap window with 4 main elements as listed above. |
Reordering Heatmap Rows
OLIVER provides a wide range of options for changing the ordering fo the rows in a heatmap. The selection and insertion cursors shown above can be used to re-order rows manually:
- Select one or more rows to reposition using the blue selection cursor. Click-and-drag on the heatmap, use the arrow keys on your keyboard.
- Select a new location to place the selected rows using the red insertion cursor. Right-click and drag on the heatmap, or use the W and S keys on your keyboard.
- Press the "Enter" key on your keyboard to re-arrange the heatmap based on your cursors.
The "Reorder" menu at the top of the heatmap window can be used to sort rows based on the data in the heatmap:
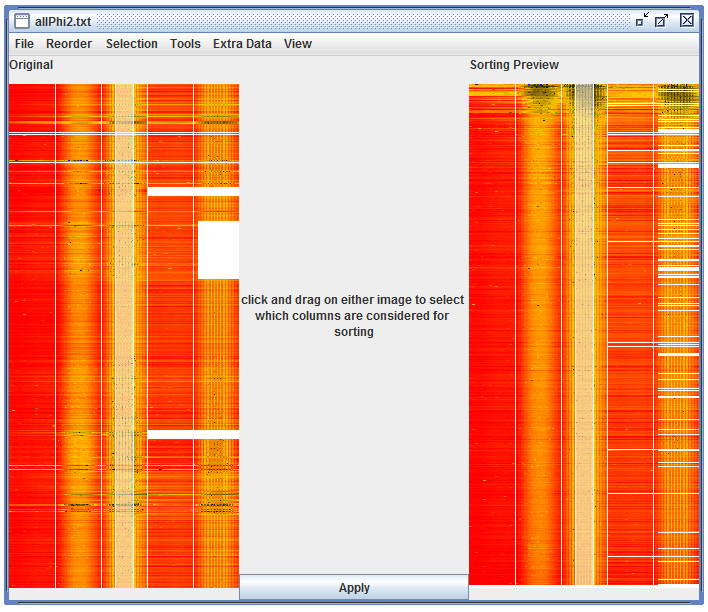
- Click "Reorder", and "Sort by average..." (for example). The window will shange to show a preview of how your heatmap might look after sorting.
- Click and drag from left to right any where on the heatmap to select the columns that should contribute towards the average to use for sorting.
- Click "Apply" to do the reordering as shown in the preview, and return to the normal heatmap view
|
|
The interactive "Reorder", "Sort by Average..." heatmap window, showing a preview of the sorted heatmap. |
Changing Heatmap Colors
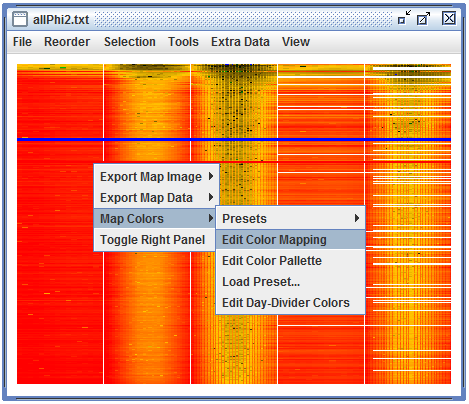
OLIVER provides interactive tools for changing the way numerical values are represented as colors, as well as a variety of presets and tools for importing colors from other programs. All of these ooptions are available in the "Map Colors" menu, which can be accessed in several ways:
- Right-click directly on a heatmap, or an a color legend
- Using the "View" menu in a heatmap window. (Note that this option is not available in the "View" menu at the very top of the screen).
For convenience, OLIVER includes all of the color presets available in the open-source ImageJ / Fiji image processing package. You can try any of these presets using "Map Colors", "Presets", "Fiji / ImageJ Luts".
|

|
|
The "Map Colors" menu, shown by right-clicking on a heatmap. |
The same heatmap with the "Royal" preset. |
Creating Figures
In the heatmap window, you can use "File", "Export Map Image" to export a heatmap to an image or PDF. It is recommended that you check the "Image Export Settings" before creating your figure. You can use "Export to Clipboard" to paste the heatmap into an image/slide in any other program.

|

|
|
Image export menu. |
Image export settings dialog. |
Saving Your Work
Besides exporting figures, you can also save a heatmap (or your entire OLIVER workspace) to a file. Depending on how you plan to use the saved file, you may choose to save just the numerical data, or also the colors and other display settings.
The most straightforward way to save numerical data is to save a .txt file using the heatmap's "File", "Save Heatmap..." button. This will save your data into a tab-delimited text file that can be loaded in OLIVER later, as well as a variety of other programs. Note that this type of fie will not include color information. The "Save Heatmap.." button also gives you the option to save a .hm file, which does include color information, but can only be loaded by OLIVER.
On the other hand, using the "File" menu at the very top-left of the OLIVER screen will allow you to save the entire workspace to a .xlsx file (excel workbook). This format is especially useful because it will maintain all of your color/display settings and save the data from each heatamp on a separate sheet in the excel workbook. This means you can open the workbook in excel, copy and paste from it, make changes, and then open it in OLIVER once again.